Tag Archives: featured

Big is not always beautiful: the Apple Heart Study

Ami Banerjee blogs about the Apple Heart Study and what the results mean


What a gift. During our fourth away day working on the Catalogue of Bias resource, a systematic compendium of all the possible biases in health research and practice, the Apple Heart Study was published in the New England Journal of Medicine.

This trial recruited 419 297 participants over 8 months. The amazing scale and speed of recruitment comfortably make this the fastest recruiting and largest trial to-date.

Atrial fibrillation (AF) is the world’s commonest heart rhythm problem and causes a significant preventable burden of stroke worldwide, but a substantial proportion is either undiagnosed or diagnosed after the stroke. Over the last few years, there has been growing interest in new ways of detecting AF at scale. Enter stage left the Apple Watch, which has an optical sensor with an irregular pulse notification algorithm.

The Apple Heart Study prospectively recruited adults over the age of 22 in an open-label design without any comparator. Participants who received a notification from the Apple Watch app were prompted to start a telemedicine consultation. Those with urgent symptoms were encouraged to attend the emergency department or urgent care. Those without urgent symptoms were sent an ECG patch to wear for up to 7 days. The ECG patches were returned by post to be checked by two clinicians.

The primary outcome was AF for more than 30 seconds on ECG patch monitoring in a participant who received an irregular pulse notification. Participants also completed a survey at 90 days.

Of 2161 (0.5%) individuals who received an irregular pulse notification, only 945 (44%) were included in the first visit, 658 (30%) had an ECG shipped, 450 (21%) returned an ECG which could be analysed, 372 (17%) completed a 90-day survey, 96 (18%) had a second visit, and 254 (12%) completed the end-of-study survey. No lack of ascertainment, compliance or detection biases here. The percentages presented here are lower than those reported in figure 1 of the NEJM  publication. because I have used all the data from those who had an irregular pulse notification (intention to test group) as opposed to analysing just those who engaged with further testing and follow up (per-protocol test group).

AF was identified in 153/450 participants who returned ECG patches, resulting in a diagnostic yield of AF on ECG patches of 34% overall (35% in the over 65 years age group and 18% in those younger than 40 years).

The authors report positive predictive values of 71% for an individual tachogram (a 1-minute recording form the Apple Watch) and 84% for an irregular pulse notification, i.e. 84% of participants with an irregular pulse notification had AF. The authors acknowledge that “the positive predictive values were measured for participants who had already received an irregular pulse notification and are therefore only an estimate of the positive predictive value of an initial notification in the overall cohort”, representing a potential spin bias.

In topical areas such as digital technology, wearables and big data, hot stuff bias and confirmation bias are also major issues. While the world still concentrates on big pharma as the source of industry sponsorship bias in trials and evidence-based healthcare, our eyes are diverted from digital technology giants, which have, on average, an order of magnitude more net worth. The size of the study population tells us less about the study, and more about Apple, the undisputed global heavyweight of digital technology companies, currently valued at $961 billion, and the appeal of its products to consumers.


Ami Banerjee, Associate Professor in Clinical Data Science and Honorary Consultant Cardiologist, UCL

Conflicts of interest: Advisory boards for Pfizer, Astra-Zeneca and Boehringer Ingelheim and Trustee for South Asian Health Foundation.

Reference:  Large-Scale Assessment of a Smartwatch to Identify Atrial Fibrillation N Engl J Med 2019; 381:1909-1917
DOI: 10.1056/NEJMoa1901183


Big Data: Big bias?

Ami Banerjee blogs about the Catalogue of Bias teams work to document the potential sources of bias in Big Data and Artificial Intelligence.


Last week, the UK government published a code of conduct for artificial intelligence (AI) and data-driven technologies in health. Major investments in big data research and AI are part of the strategy for key stakeholders across the healthcare landscape, from governments to the largest research funders.

No two terms have captured the zeitgeist of growing mountains of medical information and related analytics like “big data” and “artificial intelligence” (AI). Barely a day goes by without another journal article or media story promising new progress in healthcare, fuelling the expectation that my job as a health professional is in real danger from robots.

When terms enter the vernacular, we start to lose control of what the terms mean. Problems may arise as “big data” and “AI” mean different things to different people in different situations. I have previously defined big data by seven V’s (volume, velocity, veracity, variety, volatility, validity and value).

Big data health research includes linking millions of records to better reflect and understand the health needs of populations such as refugees and migrants, as well as linking genomic information to better treat rare diseases and the use of wearables to screen for heart rhythm problems.

AI “aims to mimic human cognitive functions”, and has been used to describe improvements in predicting long-term survival in heart failure patients as well as diagnosing retinal disease.

However, there are potential pitfalls in the use of big data. For example, how we define normal values for laboratory tests is central to how we diagnose and treat diseases, and large datasets are increasingly used to assess clinical outcomes across a range of test values. Sample size is not usually an issue, but there may be other problems. For example, haemoglobin A1c, commonly used to diagnose and monitor diabetes, has been shown to systematically underestimate past glycaemia in African American patients with sickle cell trait. If certain values and certain individuals in large datasets are repeatedly sampled, then a selective reporting bias can suggest differences in normal values which do not exist.

Big data and AI are fertile new areas for research with lots of industry involvement and funding. There is inevitably a “hot stuff bias” and a confirmation bias.

Bias has long been recognised as a problem in health research and its application. Our Catalogue of Bias project is compiling and continuously updating the various types of bias affecting health research. The advent of evidence-based medicine was accompanied by validated tools and checklists which are used to separate the wheat from the chaff in terms of the risk of bias in evidence used to underpin health care decisions. However, aside from commentary pieces, no article or project has looked at all the biases that might affect big data or AI research in healthcare. Is research using information from big data or AI any different to other methods with respect to vulnerability to biases? More importantly, is the potential for bias increased in this brave new world? Confucius said, “Real knowledge is to know the extent of your own ignorance.” If we know which biases can occur and how we might reduce them, then we can make more sense of evidence in healthcare, whether in treatment or diagnosis. In the Catalogue of Bias Collaboration, we are all working to document the potential sources of bias in Big Data and AI. I’d be interested in your thoughts.

Ami Banerjee, Associate Professor in Clinical Data Science and Honorary Consultant Cardiologist, UCL

Conflicts of interest: Advisory boards for Pfizer, Astra-Zeneca and Boehringer Ingelheim and Trustee for South Asian Health Foundation.


A Word About Evidence: 6. Bias — a proposed definition

Following the recent launch of the Catalogue of Bias on the website of the Centre for Evidence-Based Medicine, Jeff Aronson continues, in the last of three blogs, his investigation into the word “bias”, and proposes a definition.


In the first blog in this series of three, I explored the etymology and usages of “bias”. In the second I analysed definitions of “bias” that have previously been proposed in statistical, epidemiological, and sociological texts. Recurrent themes that emerged were, in order of frequency: systematicity; truth (although the concept of probability is preferred); error; deviation or distortion; the elements affected; the direction of the effect. These features should be implied or incorporated within any definition of bias in evidence-based medicine.

Operational considerations

Figure 2 shows how biases operate in relation to the observations in clinical studies.

Figure 2. How biases operate in relation to observations in clinical studies


This analysis shows how biases can affect the interpretation of results from studies, whether the results are positive, negative, or neutral. It stresses that biases can alter the apparent association between an exposure to an intervention (e.g. a medication) and a measured outcome (e.g. a biomarker) or can alter the apparent nature of an association between two measurements (e.g. two biomarkers) and that in any study multiple biases may be present and have different effects.

Sources of bias

Finally, I return to the definitions included in the OED, as cited in my first blog in this series. The dictionary gives two definitions of “bias” in its transferred usages, which are those with which we are concerned:

1. An inclination, leaning, tendency, bent; a preponderating disposition or propensity; predisposition towards; predilection; prejudice.

2. Statistics. A systematic distortion of an expected statistical result due to a factor not allowed for in its derivation; also, a tendency to produce such distortion.

That preconceptions and prejudices could act as biases in clinical medicine, highlighted in the first of these two definitions, was perhaps realised before it was appreciated that other factors can do so as well. This is reflected in Alvin Feinstein’s definition of “bias” in his textbook Clinical Judgment (1967): “The preconception that a clinician brings to his observations when he expects each instance of a disease to behave in a ‘typical’ way.” It is also seen in a reference in Hammersley & Gomm (1997) to “a tendency on the part of researchers to collect data, and/or to interpret and present them, in such a way as to favour false results that are in line with their prejudgments and political or practical commitment.”

This reminds us that biases can arise from different causes, as in the following examples:

A proposed definition of “bias”

Based on these analyses, I propose the following definition of “bias”, relevant to the Catalogue of Bias, here couched as it would appear in a standard dictionary.

bias, n. /ˈbʌɪəs/ A systematic distortion, due to a design problem, an interfering factor, or a judgement, that can affect the conception, design, or conduct of a study, or the collection, analysis, interpretation, presentation, or discussion of outcome data, causing erroneous overestimation or underestimation of the probable size of an effect or association [ancient Greek ἐπικάρσιος, crosswise, esp. at right angles, via French biais]

This definition defines the count noun “bias”, in other words, any example of the non-count noun “bias”. The non-count noun could be defined as a tendency to produce biases. The definition includes the important features of previous definitions, enumerated in this and the previous blog, recognises that different biases can arise from different sources, and acknowledges that bias can result in overestimation or underestimation of outcomes in studies of the effects of interventions or associations between different measurements.

Defining types of bias
The catalogue of bias is in progress. It will grow as new entries are added. The current list of potential entries runs to about 250 varieties, of greater or lesser importance. Probably not all of them will end up being covered in the catalogue. However, each one that does will be defined.

In crafting the definitions we shall recognize that it is conventional to name each bias after the problem, factor, or judgement that produces it, which is not itself a bias. For example, reporting is not a bias. However, if a bias – a systematic distortion – arises because of a problem with reporting, that would be called a reporting bias. So “reporting bias” could be defined as “a systematic distortion that arises from a problem with the way in which the results of a study are reported”. The many different types of reporting bias would be defined to reflect this.


Jeffrey Aronson is a clinical pharmacologist and Fellow of the Centre for Evidence-Based Medicine in Oxford’s Nuffield Department of Primary Care Health Sciences. He is also president emeritus of the British Pharmacological Society.

Competing interests: None declared.

Other articles in this series:

A Word About Evidence: 5. Bias—previous definitions – Catalog of Bias

A Word About Evidence: 4. Bias—etymology and usage – Catalog of Bias

A Word About Evidence: 5. Bias—previous definitions

Following the recent launch of the Catalogue of Bias on the website of the Centre for Evidence-Based Medicine, Jeff Aronson continues, in the second of three blogs, his investigation into the word “bias”, surveying catalogues and previous definitions.


In 1979 David Sackett, crediting the help of a clinical epidemiology graduate student, JoAnne Chiavetta, made what appears to have been the first attempt to classify the types of biases that can occur in observational studies, which he called “analytic research”. “To date,” he wrote, “we have catalogued 35 biases that arise in sampling and measurement.” In an appendix to the paper, he divided the sources of biases into these two categories and added five others, in which he included a further 21 varieties, making 56 in all. He gave references to 33 of them, implying that he was describing the other 23 for the first time, giving them original names.

Later catalogues are listed in Table 1.

Table 1. Some catalogues of biases

Source Description
Delgado-Rodríguez & Llorca (2004) 69 biases classified as belonging to one of four major groups (information bias, selection bias, confounding, and execution of an intervention) and several subgroups
Choi & Pak (2005) 48 biases detected in questionnaires, with examples of each, categorized according to the ways in which individual questions are designed, the ways in which the questionnaire as a whole is designed, and how the questionnaire is administered
Chavalarias & Ioannidis (2010) 235 examples of biases that were mentioned in PubMed in at least three articles each; they listed the 40 most commonly cited biases and constructed a network showing how frequently they were discussed and the links among them
Porta M (editor) A Dictionary of Epidemiology (6th edition, 2014) 53 biases defined in separate dictionary entries; four other biases mentioned in the text
Oxford’s Centre for Evidence Based Medicine (CEBM) Catalogue of bias (2018) See text


In 2017, taking its cue from one of Sackett’s suggestions, the Centre for Evidence-Based Medicine (CEBM) in Oxford launched its online Catalogue of Bias, in which individual biases are defined and described, with practical examples, information about the effects they are likely to have on the results of clinical studies, and methods for preventing or analysing them. As I write, the catalogue has over 50 entries either posted online or in preparation.

Previous definitions

Good definitions give clear explanations of concepts and their importance and may give insights into their potential impact. They allow us to agree on what we are talking about, avoiding ambiguity. They can highlight cultural differences so that misunderstandings can be avoided. And studies based on uniform definitions can be readily compared in systematic reviews.

Elsewhere I have described in detail my approach to crafting definitions. Briefly, it involves studying the etymology and usages of the definiendum (the word or term to be defined), considering definitions that others have proposed, and taking into consideration how the processes involved actually operate. I then list the characteristics that seem to be the most important and use them to create a definition.

In my previous blog about bias, I discussed its etymology and its usages since the 16th century. Here I discuss definitions that others have proposed in statistics and epidemiology.

I have searched widely for definitions of “bias” in books and journal articles. In many cases authors offer no definition at all. Some of those that do define “bias” use Sackett’s definition. In Table 2 I have listed other definitions that I have found. This is not a complete list, but other definitions contain all the elements included in the definitions listed in the Table.

Note that this is a heterogeneous group of definitions, in that some define the count noun “bias”, where each bias is an individual example of the phenomenon, while others define the non-count noun, which is the phenomenon itself. Failing to distinguish these two uses can lead to ambiguity. I shall concentrate on defining the count noun.

Table 2. Published definitions of “bias” in statistics, epidemiology, and sociology

Source Definition
Nisbet (1926) In an experiment with a finite number of chance results, if one of the factors, on which the result of the experiment is dependent, is related physically, in a special way, to some of the alternatives, then these alternatives are biassed [sic]
Murphy EA. The Logic of Medicine (1976) A process at any stage of inference tending to produce results that depart systematically from the true values
Sackett D (1979) [Based on Murphy 1976] Any process at any stage of inference which tends to produce results or conclusions that differ systematically from the truth
Schlesselman JJ. Case-Control Studies: Design, Conduct, and Analysis (1982) Any systematic error in the design, conduct or analysis of a study that results in a mistaken estimate of an exposure’s effect on the risk of a disease
Steineck & Ahlbom (1992) The sum of confounding, misclassification, misrepresentation, and analysis deviation
Hammersley & Gomm (1997) [One of several potential forms of] systematic and culpable error …  that the researcher should have been able to recognize and minimize [they also refer to other interpretations, such as: any systematic deviation from validity, or to some deformation of research practice that produces such deviation]
Elliott P, Wakefield JC. In: Spatial Epidemiology (2000) Deviation of study results (in either direction) from some “true” value that the study was designed to estimate
Delgado-Rodríguez & Llorca (2004) Lack of internal validity or incorrect assessment of the association between an exposure and an effect in the target population in which the statistic estimated has an expectation that does not equal the true value
Choi & Pak (2005) A deviation of results or inferences from the truth, or processes leading to such a deviation
Sica (2006) A form of systematic error that can affect scientific investigations and distort the measurement process
Paradis (2008) A systematic error, which undermines a study’s ability to approximate the truth
Cochrane Methods Group A systematic error, or deviation from the truth, in results or inferences [continues: Biases can operate in either direction …]
CONSORT Systematic distortion of the estimated intervention effect away from the “truth”, caused by inadequacies in the design, conduct, or analysis of a trial
A Dictionary of Epidemiology (6th edition, 2014) Systematic deviation of results or inferences from the truth. … An error in the conception and design of a study—or in the collection, analysis, interpretation, reporting, publication, or review of data—leading to results or conclusions that are systematically (as opposed to randomly) different from the truth
Schneider D, Lilienfeld DE. Lilienfeld’s Foundations of Epidemiology. 4th edition. (2015) A systematic error that can creep into a study design and lead the epidemiologist to inaccurate findings


Common features in definitions

From the frequencies of their appearance in these 15 definitions, the following features emerge as being important.

Systematicity: Ten of the definitions make it clear that biases arise from systematic rather than random processes. Figure 1 shows how apparent outcomes vary depending on the relative amounts of systematic and random errors, dichotomously categorized.

Truth: Nine of the definitions refer to the true outcome, or truth, as that from which bias causes deviation. However, I believe that it is preferable to refer to the probability of an outcome, or the outcome that would be found in the absence of bias, rather than implying that there is some definitive truth to be discovered. Reflecting this, four definitions include the word “estimate[d]”, even though three of them also included the words “true” or “truth”.

Error: Eight definitions refer to “error” or related words, such as “incorrect” and “inaccurate”.

Deviation or distortion: These words feature in seven definitions. They refer to the extent to which the apparent result of a study differs from the result that would be expected were there to be no bias. In relation to this, “results” appears in seven definitions and “expectation” in two.

The elements affected: Six definitions refer to the conception, design, and conduct of a study, and the collection, analysis, interpretation, and representation of the data, all of which may be affected by biases. I take “representation” here to mean the figurative and tabular display of data, to which one could, therefore, add discussion of its relevance, which might also be subject to bias.

Direction: Two definitions highlight the fact that a distortion can occur in either direction, underestimating or overestimating the effect that would emerge in the absence of a bias; I consider it important to stress this.

Figure 1. How the results of a study may deviate from the “truth” (middle target)


  • Top left: a well-designed study should yield results that are precise although they will probably be less accurate than the “truth”; this is commonly called good internal validity


  • Top right: bias, due to large systematic error, gives results that are accurate but imprecise


  • Bottom left: large random error gives results that are neither accurate nor precise


  • Bottom right: a combination of large systematic and random errors

This information will be useful when in the third and final blog in this series, I shall explore an operational approach to bias and suggest definitions that are relevant to the entries in the CEBM’s Catalogue of bias.


Jeffrey Aronson is a clinical pharmacologist and Fellow of the Centre for Evidence-Based Medicine in Oxford’s Nuffield Department of Primary Care Health Sciences. He is also president emeritus of the British Pharmacological Society.

Competing interests: None declared.

A Word About Evidence: 4. Bias—etymology and usage

Following the recent launch of the Catalogue of Bias on the website of the Centre for Evidence-Based Medicine, Jeff Aronson explores the origins and uses of the word “bias” in the first of three blogs.


The term “bias”, as used in evidence-based medicine, has been defined in different ways. My aim in these blogs is to explore various aspects of bias, in order to develop a definition that encompasses all the entries in the Catalogue of Bias. In this first blog. I trace the origins of the word.

Etymology and usages

The word “bias” goes back to an Indo-European root that doesn’t look at all related—SKER. In its basic form, this root, one of whose primary meanings is to cut, gives rise to a wealth of English words with connotations of cutting, such as shear, shears, and sheer, score, scar, scabbard, scarp and escarpment, scrabble, scrub and shrub, scurf, shard, sharp, short and skirt, skirmish, scrimmage, and scrum.

Variants on the related root KER give us words such as cortex and decorticate, curt and cutlass. The Greek adjective κάρσιος, karsios, meant [cut] crosswise. Adding the prefix ἐπι, giving a sense of motion, gave ἐπικάρσιος, epikarsios, which also meant crosswise, but often in the more restricted sense of running at right angles, describing, for example, a striped garment, the planks of a ship, or a grid of streets. It was also used to describe coastlines, as opposed to paths running inwards perpendicular to the coast. And from ἐπικάρσιος, with consonantal shift and elision, and via French biais, comes bias.

Bias in bowling

A well-known example of bias is found in the two varieties of the British sport of bowls. Crown Green Bowls is played outdoors on a grass or artificial lawn with a raised centre (the crown), which is up to 12 inches (30 cm) higher than the periphery of the green, and from which the lawn slopes down unevenly on all sides. In Flat Green Bowls, which can be played outdoors or indoors, there is no crown. In both variants, a ditch surrounds the green, which is usually rectangular or square. The size of the green is not specified, but outdoor greens are on average 33–44 yards (30–40 m) in length and of variable width, typically up to 66 yards (60 m). The area is divided in imagination into rectangular strips called rinks, each about 5–6 yards wide, usually running parallel to the sides, in which pairs or teams of players compete. First, a jack, a miniature bowl, is rolled from one end of the rink to the other, typically at least 21 yards (19 m) away. The object of the game is then to roll your bowl along the ground so that it stops as close to the jack as possible. But here’s the catch. Both the jack and the bowls are asymmetrically shaped, and this asymmetry, known as bias, distorts the direction in which they travel—in a curve, not a straight line (see Figure 1). All the other modern meanings of “bias” come from this meaning.

Figure 1. Bias in bowling
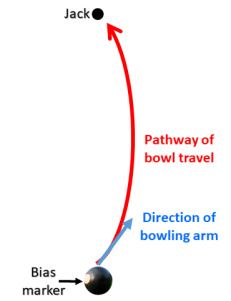
Therefore, when it entered English in the middle of the 16th century, “bias” meant an oblique or slanting line (a bias line), like the diagonal of a quadrilateral or the hypotenuse of a triangle, or a wedge-shaped piece of cloth cut into a fabric. It then came to be applied to the run of a bowl and hence “the construction or form of the bowl imparting an oblique motion, the oblique line in which it runs, and the kind of impetus given to cause it to run obliquely” (Oxford English Dictionary).

Shakespeare used the word eleven times in eight plays. For example, in The Taming of the Shrew (iv:6:25) he used it in its original literal meaning: “Well, forward, forward. Thus the bowl should run, And not unluckily against the bias.” And again, in Troilus and Cressida (iv:6:8), “Blow, villain, till thy spherèd bias cheek Outswell the colic of puffed Aquilon”. However, in most cases he used it figuratively, as in Richard II (iii:4:4): “Twill make me think the world is full of rubs, And that my fortune runs against the bias.” And in King John (ii:1:575): “Commodity, the bias of the world.” In this usage, the word means “an inclination, tendency, or propensity, and hence a predisposition, predilection, or prejudice”, the sense in which the word is most commonly used nowadays in general parlance.

It wasn’t until about the start of the 20th century that the idea of bias was introduced into statistics, defined as “a systematic distortion of an expected statistical result due to a factor not allowed for in its derivation; also, a tendency to produce such distortion” (OED). The term “distortion” here is particularly apt, since it comes from the Latin verb torquere, meaning to twist or turn to one side, just like a bowl does on a bowling green.

Other technical meanings have also emerged, for example in telegraphy and electronics. More recently terms such as “bias attack”, “bias crime”, and “bias offence” have emerged to describe various forms of so-called hate crime.

In my next blog, I shall consider catalogues of biases and previous definitions. In my final blog, I shall propose a definition of “bias” that is relevant to the entries in the Catalogue of Bias.


Jeffrey Aronson is a clinical pharmacologist, working in the Centre for Evidence Based Medicine in Oxford’s Nuffield Department of Primary Care Health Sciences. He is also president emeritus of the British Pharmacological Society.

Competing interests: None declared.

The Dunning-Kruger Effect

Are your evidence appraisals a victim of the Dunning-Kruger effect… or are you just better than the rest?

Thomas Frost & David Nunan


Almost twenty years ago, two researchers from Cornell University published an Ig Nobel Prize-winning paper. If you haven’t read it, you should really check it out.[i] In the interests of time and the $11.99  fee, it begins with the endearing story of a would-be bank robber named McArthur Wheeler.

In 1995, Mr Wheeler made the critical error of confusing the ‘invisible ink’ properties of lemon juice with the visual properties of everything else and walked into a bank with lemon juice smeared all over his face. Robbing two banks over the course of a single day, he was reported to be incredulous when the police caught him later that same day, using CCTV footage of his face. “But I wore the juice!”, he exclaimed.[1]

Fast forward 20 years, and reflecting on 100 days in the job, President Trump retorts “I thought it would be easier. This is actually more work.” Or as he might have put it “But I wore the juice!”.

What Wheeler and Trump demonstrate in action is a cognitive bias first described in 1999. Over several in-house experiments (none of which resulted in jail for the participants), David Dunning and Justin Kruger observed a finding that has gained cult status: participants tested on a task and asked to assess their own performance behaved in a seemingly paradoxical way.

In every instance, those who scored highest would under-score their performance as just above average, while the worst performers were  ‘over-optimistic’ in their self-perceptions. Whether the test was humour, logic, or grammar, the findings were the same – as cognitive talent worsens, so too does ‘meta-cognition’ (or the ability to assess ourselves accurately in that area). Thus, the Dunning-Kruger effect was born.

Sometimes though, the Dunning-Kruger effect is mischaracterised as ‘stupid people don’t know they’re stupid’, which is an unfortunate and ironic misunderstanding. The bias has little to do with ‘intelligence’ per se. There are plenty of smart, confident, but bad drivers out there.  These drivers don’t think they are F1-level drivers, they just rate themselves as ‘pretty good’ at the skills they think define good driving.

The point is that we judge our own performance based only on the markers of skill that we already know and think about. Most people know what F1-driving ability looks like, and can confidently say they aren’t at that level. But in terms of general driving ability, if we don’t know the small details that might make a good driver, we’ll never include these qualities when assessing our own ability.

What Dunning and Kruger showed was that as you become increasingly skilful at a task, and begin to appreciate how little you really know, you start to rate your ability less favourably than those who are less skilful. Until you reach that level, you’re destined to hype yourself up based on the limited knowledge you have.[2]

A cartoon depiction of the Dunning-Kruger effect:

Which brings us, in a roundabout way, to the point of this post. If the Dunning-Kruger effect can be demonstrated for a range of skills, whether manual or intellectual, sporting or vocational, it isn’t much of a leap to say that this effect probably exists for anyone who uses and appraises research. We’d wager there’s a Dunning-Kruger relation between confidence in the ability to appraise research and how many research biases the reader is aware they know.

Why not try it out yourself? Or are you just better than the rest?


Thomas Frost: University of Oxford final Year Medical Student

David Nunan: Departmental Lecturer and Senior Researcher at the Centre for Evidence-Based Medicine,  Nuffield Department of Primary Care Health Sciences, University of Oxford. He is also the lead tutor of the Practice of Evidence-based Health Care module on the MSc in Evidence-based Health Care. You can follow him on Twitter @dnunan79

Conflicts of interest: none reported


References

[1] Tragically, Mr Wheeler tested out his theory first with a polaroid camera. Sure enough, the ‘selfie’ he took printed as a blank image, almost certainly due to defective film.

[2] Meanwhile, at the other end of the scale, the truly expert individuals have a mistaken perception of how ‘basic’ certain pieces of their knowledge are (relative to the sheer unknowns still out there), and over-optimistically attribute that knowledge to others.

[i] Kruger, J and Dunning, D. “Unskilled and unaware of it: How difficulties in recognizing one’s own incompetence lead to inflated self-assessments.”. Journal of Personality and Social Psychology, 77(6), 1999, pp. 1121-1134.