Jeffrey K Aronson, Douglas Badenoch, Jon Brassey, Iain Chalmers, Claire Friedemann Smith, Emily McFadden and David Nunan blog about creating an efficient way to classify biases in healthcare research
“Taxonomy is described sometimes as a science and sometimes as an art, but really it’s a battleground.”
― Bill Bryson, A Short History of Nearly Everything
As we write this, there are 49 named biases listed alphabetically in the CEBM’s Catalogue of Bias (CoB), and it promises to grow. Our complete list of potential entries currently runs to about 250. This number is overwhelming, especially if you don’t know the name of the bias you are trying to locate. Who would ever guess what Neyman’s bias is, just from the name? As the number of biases in the Catalogue grows, we need to organise them in a user-friendly way.
At the third meeting of the CoB team on 28 February and 1 March 2019, we started to untangle and classify the different types of biases in a way that would help those consulting the Catalogue. Our motivation is to make the content of the Catalogue more accessible to users, particularly those who may be new to biases in research, and to identify the relationships that link different types of bias. Researchers aiming to draw valid conclusions from their research need to be aware of the different ways in which biases can undermine it. But to be clear, we are not trying to organise biases systematically. In future it may be possible to follow a more systematic approach, including evaluating the work of our predecessors. But for now, our approach is a pragmatic one.
Who needs it?
The Catalogue is attracting a range of visitors. Substantial numbers of researchers, health professionals, students, and members of the public are using the site to find out about biases [1]. This has led us to consider how and why users consult the Catalogue.
Researchers and health professionals may like to see a classification of biases by study type, so that they know which biases are likely to affect their research or clinical question. Other users might want to interpret published results by detecting possible biases or to understand how some of the technical definitions of biases relate to broader concepts, such as “reporting bias” and “selection bias”. And those of us tasked with managing the Catalogue would use a taxonomy to integrate related learning resources.
Biases are typically grouped into two top-level biases: Selection biases and Information biases. We used these classes as a starting point for discussion, but it soon became clear that a simple hierarchical approach has limitations. For instance, observer bias and reporting bias can both be considered types of information bias, under which other biases fall, adding complexity to a simple hierarchy.
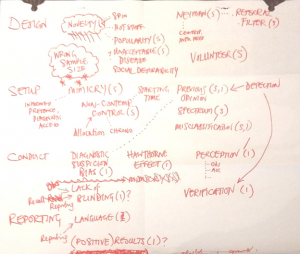
We decided that we could gain further insights if we classified biases using the research study timeline. We looked at what could be learned from the organisation of biases in both the James Lind Library and the Health Knowledge website, and we categorized biases according to how they affect the various stages of a study, such as Design, Setup, Conduct, and Reporting.
This approach is similar to the classification that David Sackett introduced in his 1979 paper in the Journal of Chronic Diseases, using the following headings:
- biases in reading up on the field;
- biases in specifying and selecting the study sample;
- biases in executing the experimental manoeuvre or exposure;
- biases in measuring exposures and outcomes;
- biases in analysing the data;
- biases in interpreting the analysis.
Fuzzy bias
It is clear that any means of categorising biases should accommodate the complex and fuzzy relationships between them. For example, we discussed two terms – ‘confounding’ and ‘spin’ – which have sometimes been conceptualised as biases. We decided that ‘confounding’ can result from one or more biases (such as selection bias), and that ‘spin’ is a type of reporting bias.
We tried to work out the relationships between biases – and how to display them in a way that is helpful. This is complicated by the fact that the definitions of some biases overlap substantially with those of other biases, with only subtle differences between them. Similarly, the same bias might have different effects, or different countermeasures, in a different type or stage of a study. In essence, it’s going to be messy, as you can see from our rough draft of a timeline of biases.
We are in the process of deciding how best to display this to users and incorporate it into our content management system. With this in mind, if you can point to other attempts to classify biases, particularly any that have tested the usefulness of the classification in practice, or if you have any other comments to help us meet the needs of CoB users, please let us know. You can get involved in the discussion below or on Twitter via @Catalogofbias and #taxonomyofbias.
We shall meet again soon to develop our ideas and we look forward to sharing our progress with you.